SaaS Metrics Benchmark Calculator
Your SaaS decisions are only as strong as your baseline metrics. Benchmark churn, LTV:CAC, and trial conversion clearly — colour-coded, decision-ready, no spreadsheet lag.
Your Results
Scores against the median, today. The question is what moved since last week.
Duct reads your ads, analytics and revenue tools, answers that question, and proposes the change. You approve it.
What this means
Benchmark scores tell you where you stand. They don't tell you what changed this week.
Duct reads churn, CAC and conversion across your tools every time you ask, says what moved and why, and proposes the fix before it becomes a quarter.
How Duct works →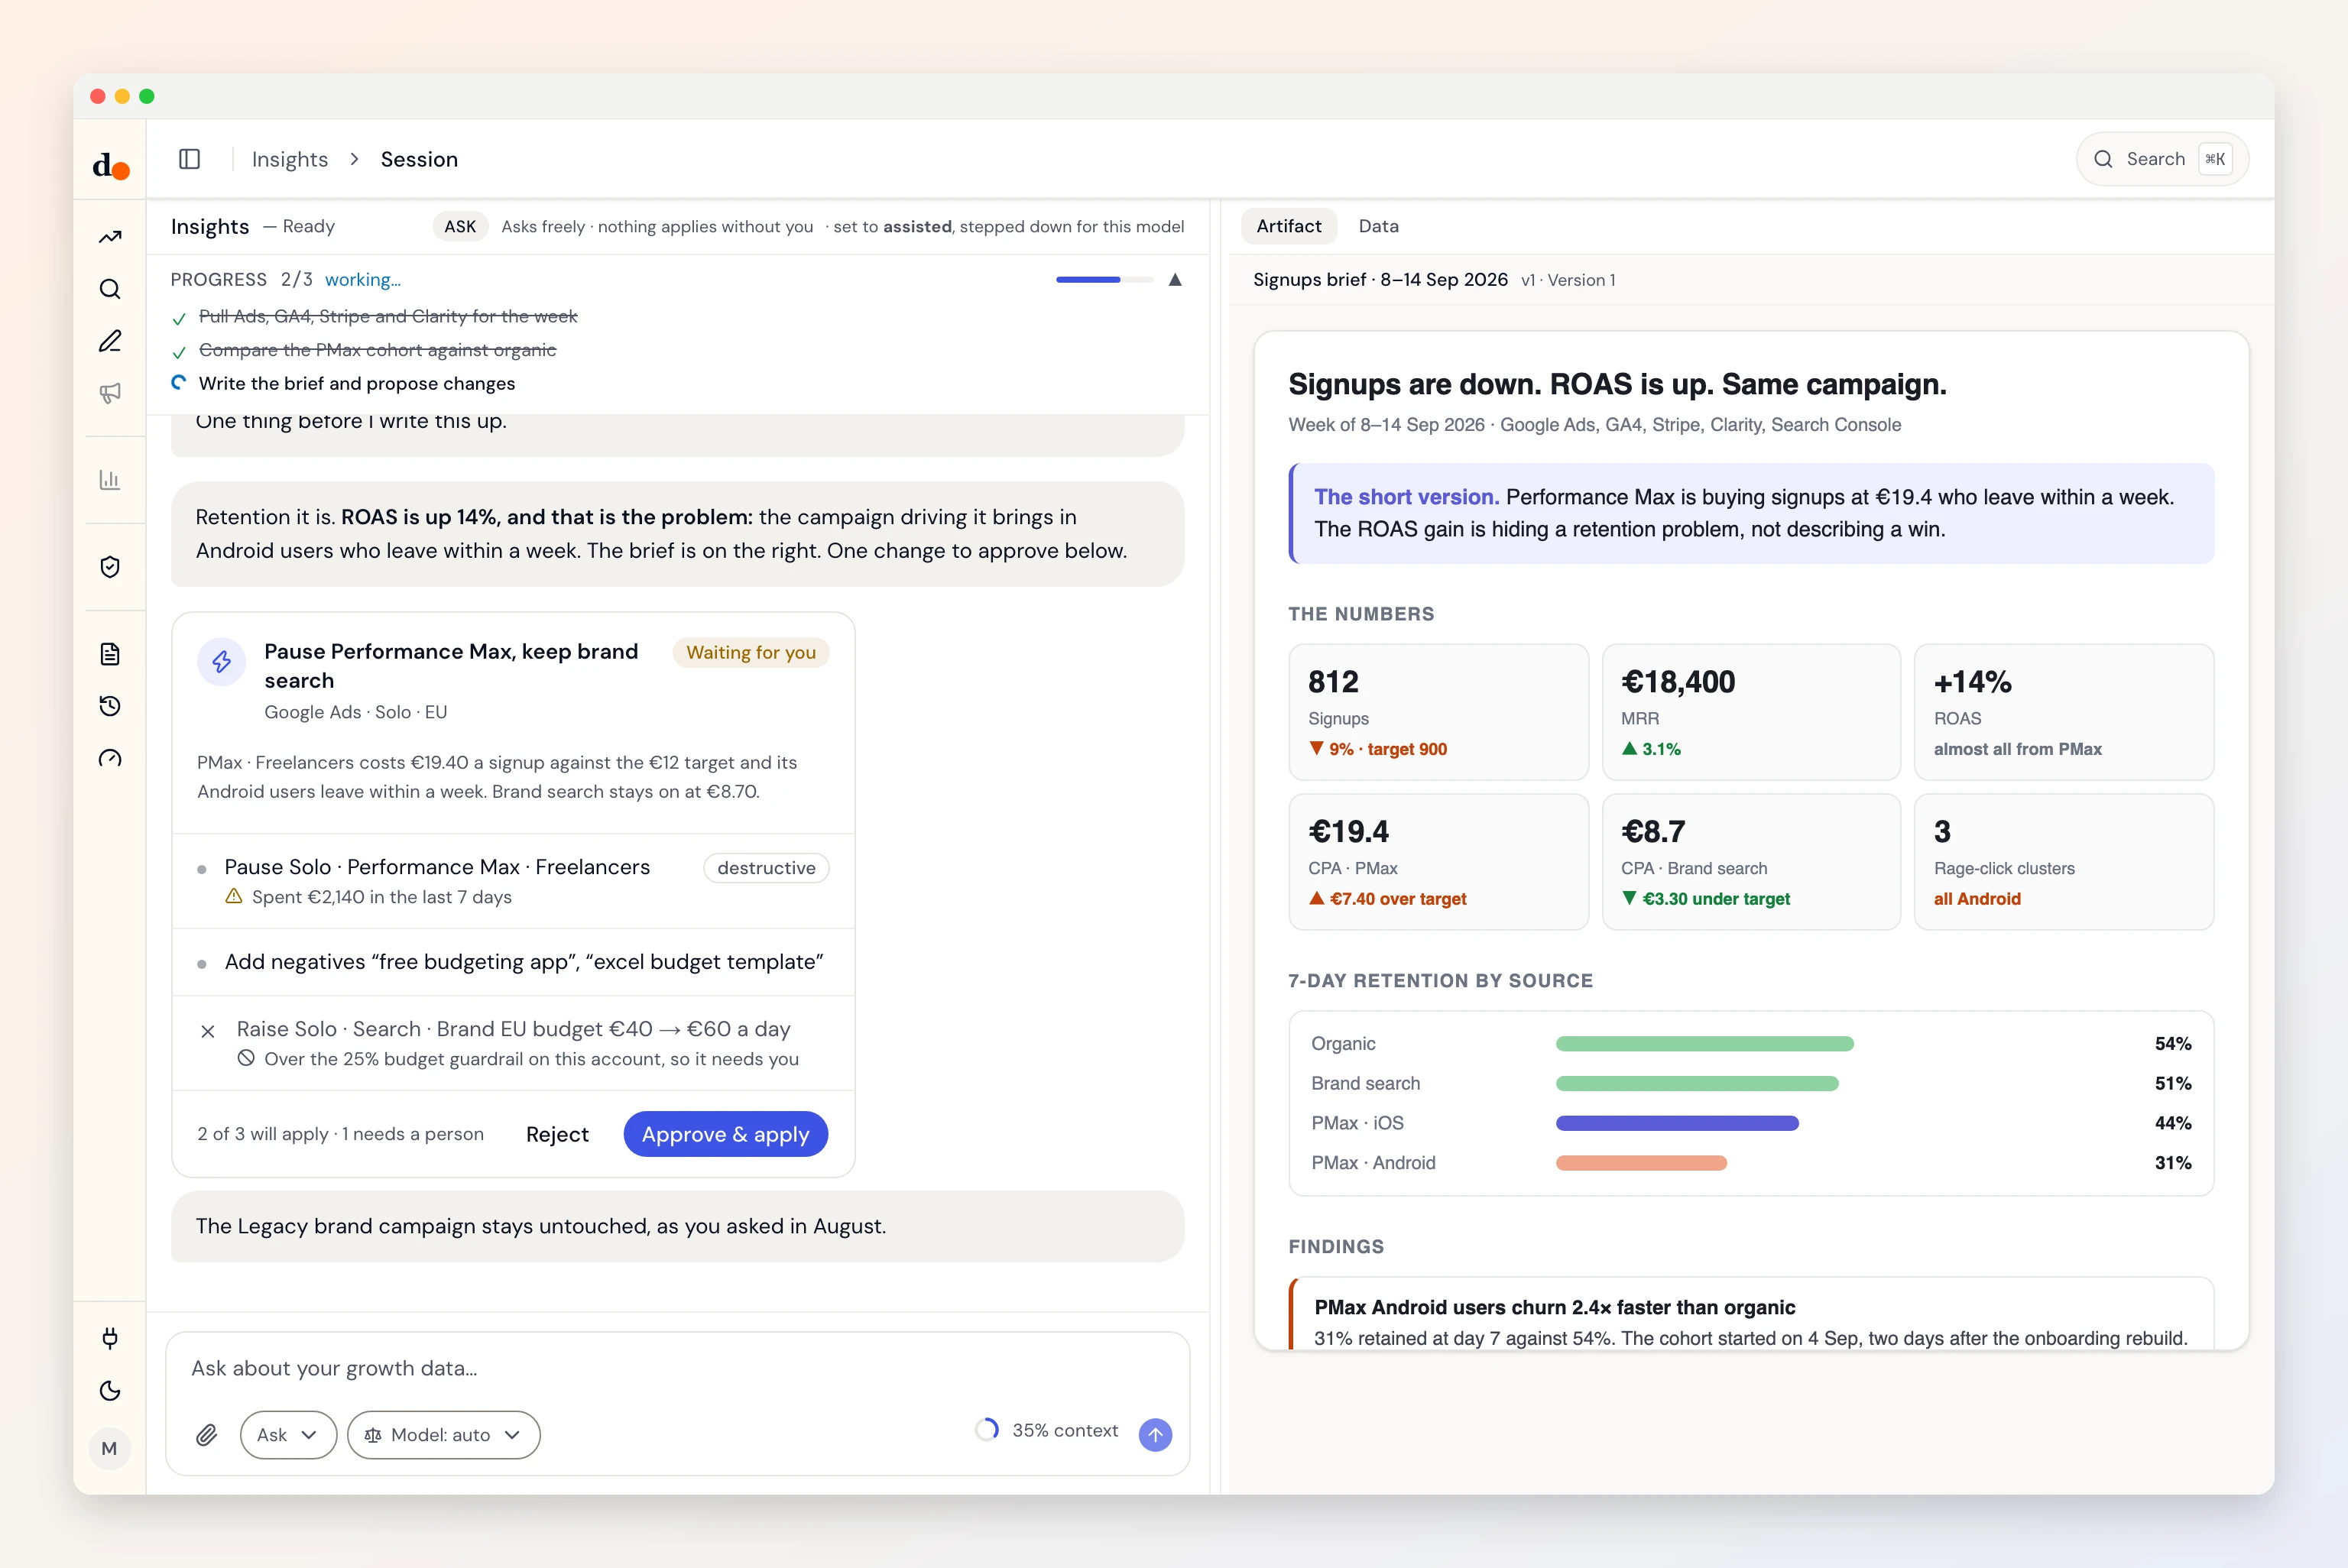
About this calculator
This tool benchmarks your core SaaS health metrics against industry averages segmented by MRR band. Enter your numbers and see a colour-coded score for each metric — green means above median, amber means room to improve, red means it's costing you compounding.
What each metric means
Monthly churn rate is the percentage of your customer base (or revenue) that cancels each month. It's the single most important metric in SaaS because it determines the ceiling on your LTV. At 4% monthly churn you're losing ~40% of your base annually — new growth just refills the leaking bucket.
LTV:CAC ratio tells you how efficient your growth is. For every unit you spend acquiring a customer, how many units do you recover over their lifetime? Below 3:1, you're not building durable economics. Above 5:1 may signal underinvestment in growth.
CAC payback period is how many months it takes to recover acquisition cost from monthly revenue (revenue payback), or from gross profit if you enter gross margin % (contribution payback).
Trial-to-paid conversion measures how much of your top-of-funnel interest converts to real customers. Below 15% usually indicates onboarding or product-market fit issues. Above 25% is healthy for most B2B SaaS.
Limitations
- Benchmarks are based on industry averages and may not reflect your specific vertical or go-to-market motion.
- LTV auto-calculation assumes constant churn and does not account for expansion revenue. Payback can use optional gross margin for contribution-based months to recover CAC.
- Trial-to-paid benchmarks vary between product-led and sales-led models.
- All calculations happen in your browser — no data is sent or stored.
FAQ
Frequently asked questions
What is a good SaaS churn rate?
A good monthly churn rate for SaaS is below 2%. Between 2–4% is average and needs attention. Above 4% monthly churn is critical — at that rate you're losing nearly half your revenue base each year. Benchmarks vary by stage: early-stage SaaS typically sees higher churn than mature products.
How do I calculate LTV for a SaaS business?
LTV = Average Monthly Revenue per Customer ÷ Monthly Churn Rate. For example, if ARPU is €100 and monthly churn is 2%, LTV = €100 ÷ 0.02 = €5,000. A gross-margin-adjusted version: LTV = (ARPU × Gross Margin %) ÷ Churn Rate. This calculator uses the simple version unless you provide your own LTV.
What is a healthy LTV:CAC ratio?
A healthy LTV:CAC ratio for SaaS is above 3:1 — for every €1 spent on acquisition, you recover €3 in lifetime value. A ratio of 2–3:1 covers costs but doesn't build strong unit economics. Below 2:1 typically means the model isn't viable at scale. Above 5:1 often signals underinvestment in growth.
How often should I track SaaS metrics?
Track MRR, churn, and new customers monthly. LTV and LTV:CAC are meaningful quarterly since they're slow-moving. A weekly brief covering the 4–5 metrics that matter most beats a monthly spreadsheet dump every time.
What data sources does this calculator use?
Benchmarks come from OpenView Partners' SaaS Benchmarks Report (2023–2024) and ChartMogul's SaaS Benchmarks Report. LTV:CAC thresholds follow the widely-cited 3:1 standard from David Skok's SaaS metrics framework at For Entrepreneurs.